Packet Captures
SnapNet packet captures are generated server-side and stored as JSON files. These files get large very quickly so it’s recommended to only capture for a few seconds at a time. Once generated, these capture files are designed to be viewed in Chrome Tracing. By inspecting packet captures, you can identify exactly how much bandwidth each entity and field is consuming per-client.
Generating Packet Captures
Packet captures can be started by calling USnapNetServer::StartPacketCapture() and stopped by calling USnapNetServer::StopPacketCapture(). There are also console commands available to perform these functions. Packet captures will be stored in the project’s Saved/PacketCaptures folder.
Viewing Packet Captures
Packet captures are generated in a JSON format designed to be viewed in Chrome Tracing. To load a capture:
- Open Chrome
- Navigate to
chrome://tracingin the address bar - Click Load and open the packet capture located in the project’s Saved/PacketCaptures folder
Once loaded, you can navigate with the following keys:
Left-click + drag: Pan the timeline left/right
Alt + Mouse Wheel: Zoom in/out
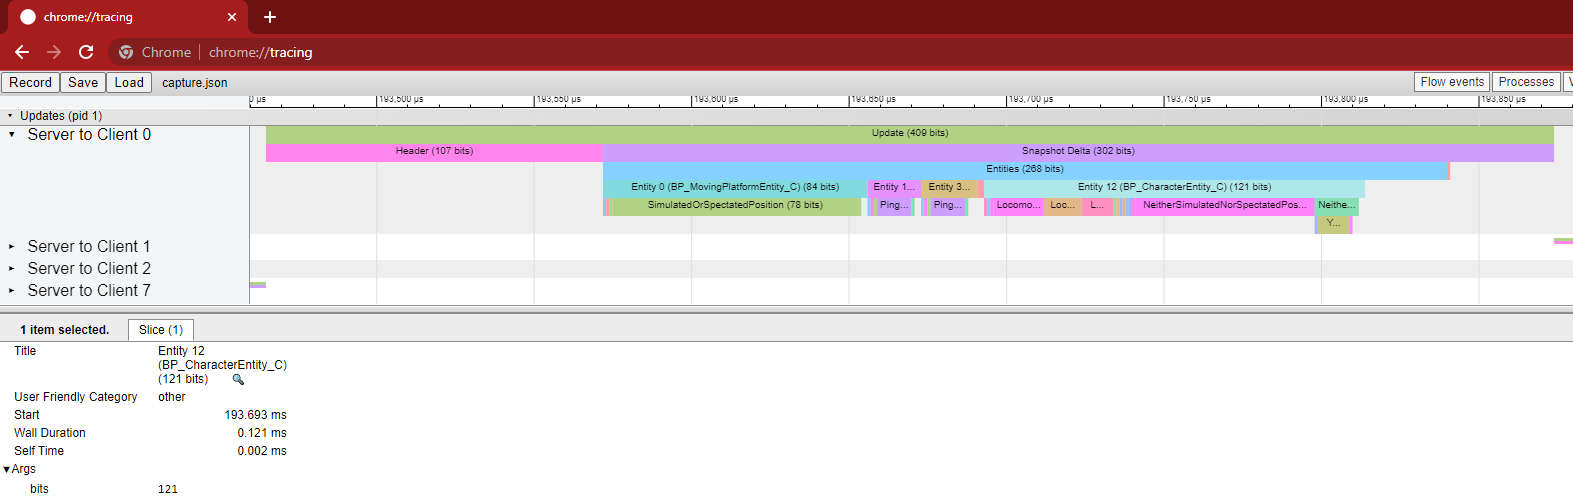
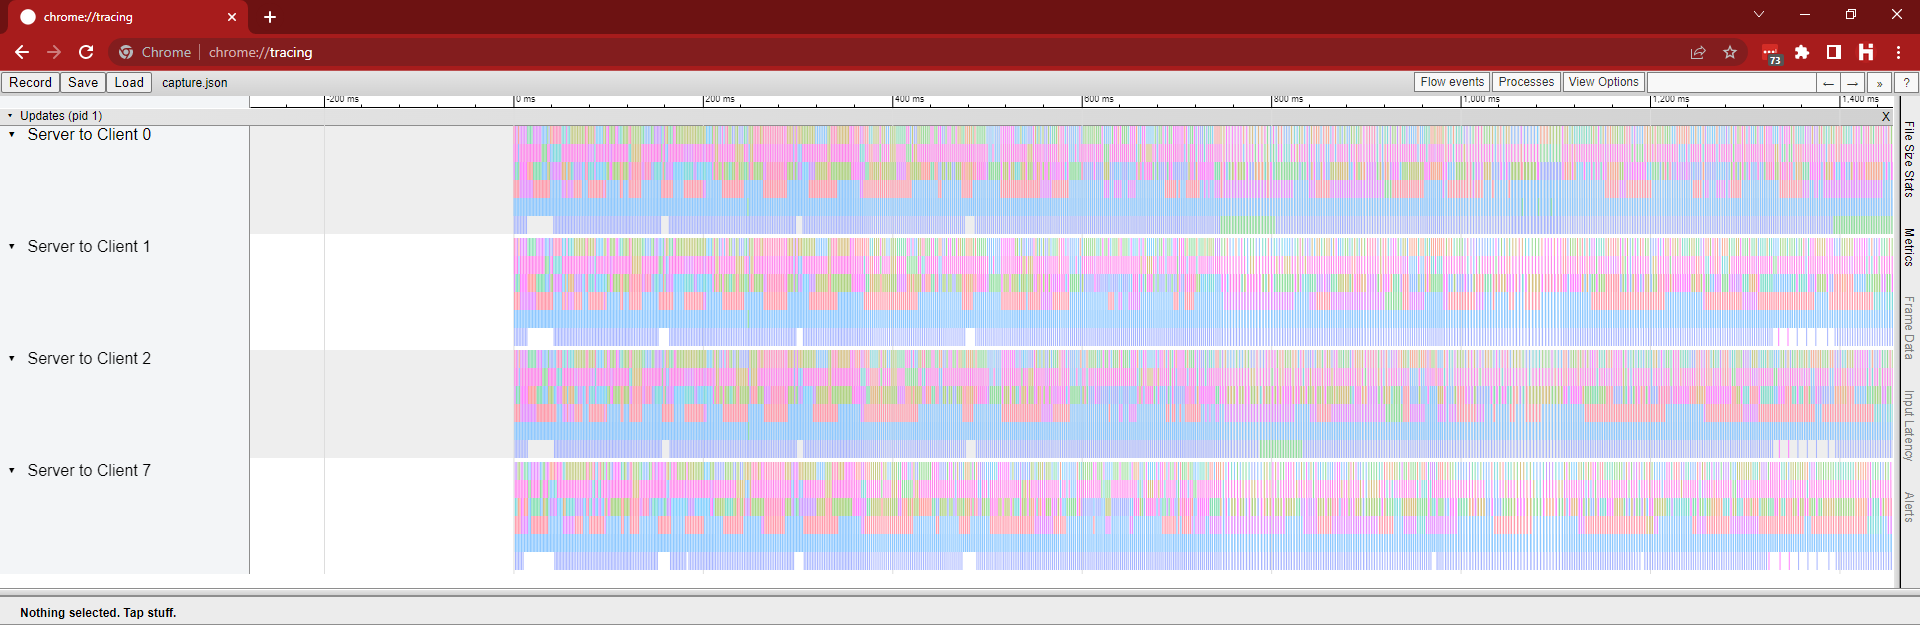
On the left side of the page you will find one collapsible row per client. Zoom in with Alt + Mouse Wheel Up to inspect the data. Each message sent from server to client is displayed chronologically from left to right. Messages are broken down into their component parts hierarchically from top to bottom.
You can click on any colored segment to select it. The segment’s full name and how many bits it occupied in the message will be displayed in the bottom panel. The width of a given segment is directly proportional to how many bits it represents so it can be helpful to look for any updates, entities, or fields which are disproportionately large relative to the others.